Viewing log events
Events describe system, component, client, or custom application activities and errors. You can view events in Policy Tree or in the Venafi Configuration Console (VCC). For more information, see Reviewing log events in VCC.
Before you view events, you must:
- Configure the Log View Database Access credentials in the Default SQL Channel or your own channel object.
- Configure View Database Access credentials for the current channel Log. An administrator must have a minimum of the Read permission.
To view log events in the Policy Tree
-
From the Platform menu bar, click Policy Tree.
You must have Read permissions to the object.
-
Do one of the following:
- To view the entire log: In the Logging Tree channel, click Default SQL Channel, and then click the General > Permissions tab.
-
To get events about an object: Navigate to its location in one of the following trees: Encryption, Identity, Platforms, Remote, Policy, or Reports. Click the General > Log tab.
Event Log Data Field
Description
Client Time The time the event generated at the client. Severity One of these event severities: Emergency, Alert, Critical, Error, Warning, Notice, Info. Note: Debug messages do not appear in the event log.
Event The event name as defined in the Event Definitions folder. Description The corresponding event text. Component The Distinguished Name (DN) of an object that originated the event. For events that occur in a subsystem other than Config, such as a Secret Store, the component may be blank. Component ID The component ID that originated the event. Component Subsystem The component subsystem that originated the event. Grouping An integer that corresponds to a set of events that involved the Component. Text 1 Corresponds with Value1. A string variable that may be referenced by the event translation as defined by the log schema. For example, Text1: Heavy job.
Text 2 A second string variable that may be referenced by the event translation as defined by the log schema.
Value 1 Corresponds with Text1. An integer variable that may be referenced by the event translation as defined by the log schema. .
Value 2 Corresponds with Text2. A second integer variable that may be referenced by the event translation as defined by the log schema.
MIME Type The data format, such as TEXT_PLAIN. Data Size The number of bytes in Data. Data Additional Information, such as the call stack.
-
(Optional) Do one or more of the following:
- To sort any column in ascending or descending order, click a column heading.
- To filter events, mouse over any column heading, and choose the appropriate filter. The options that appear depend upon the column you select.
-
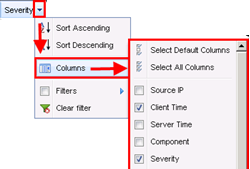
To show more columns, mouse over any column heading, and then click the columns that you want to display in the Log tab.

- To save your settings, open the Admin menu and click the share icon.
-
(Optional) Use any of the following options to manage the log event records:
Event log options Field
Description
 Filters
Filters the events listed in the tab based on parameters defined for one or more column headings.
 Export
 Exports the data currently displayed on the Log tab to a CSV, tab-delimited, HTML, or XML file.
Up to:
Sets the number of records to display in the tab. The maximum is 50,000 records.
 Refresh
Refreshes the current view to display the most recent events triggered by the current object.